
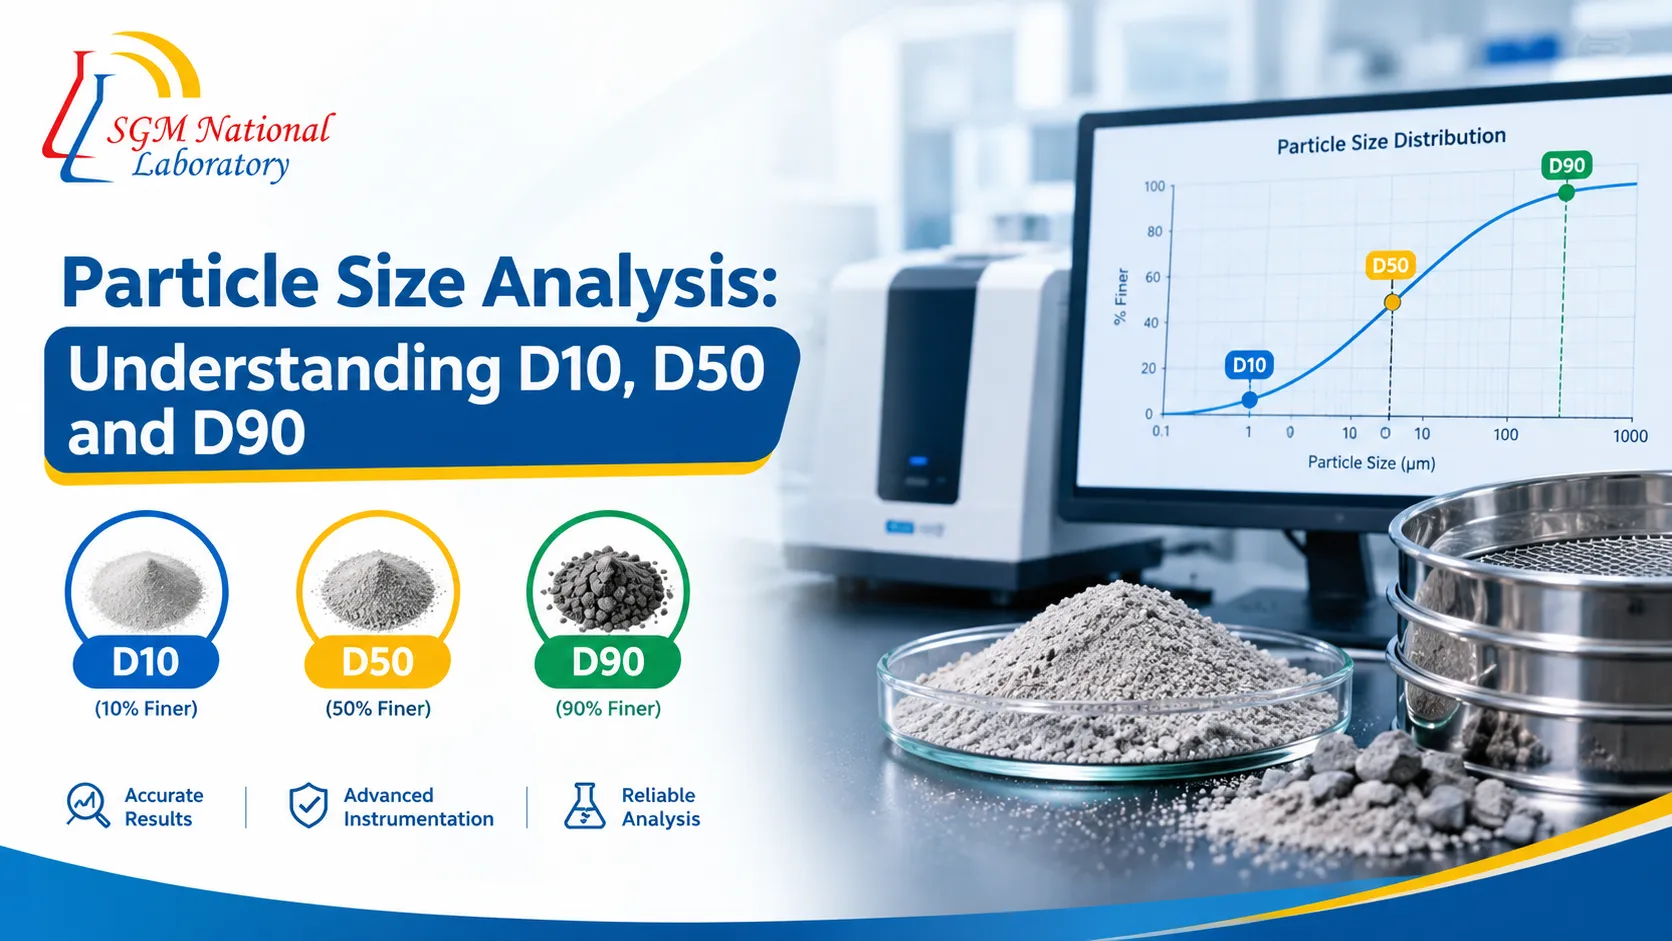
Open a particle size report and you will usually spot three numbers near the top: D10, D50 and D90. They look simple, but they say a lot about your material. Read them properly and you can work out why a powder clumps, why a tablet dissolves slowly, or why a batch that passed last month suddenly fails.
This guide explains particle size distribution analysis in plain language. We will go through what D10, D50 and D90 actually mean, how labs measure them, and what to keep in mind when you send samples for testing.
What Is Particle Size Distribution Analysis?
No powder is made of identical particles. Even a well-milled material is a mix: some particles are very fine, some are coarse, and most sit somewhere between. Particle size distribution analysis measures that mix and shows how much of your sample falls at each size.
This is why a single average rarely tells the whole story. Imagine two powders that both average 20 microns. One is tightly packed around 20. The other is a blend of fine dust and chunky granules that just happens to average out at 20. On paper they look the same. In the hopper, the mixer or the final product, they behave very differently.
Why Particle Size Matters in Real Production
Particle size affects how a material flows, dissolves, settles, reacts and packs together. Here is where it shows up most often:
- Pharmaceuticals: dissolution rate, absorption and tablet uniformity
- Paints and coatings: colour strength, gloss and how well the pigment stays suspended
- Cement and minerals: strength gain, setting time and reactivity
- Ceramics: how the material sinters and how dense the final piece turns out
- Food and cosmetics: texture, smoothness and shelf life
- Battery materials: consistent electrode performance
A small shift in the distribution can be enough to reject a batch, so getting reliable numbers early saves a lot of money and time later.
Understanding D10, D50 and D90
The “D” stands for diameter. The number that follows tells you what percentage of the sample, by volume, is smaller than that diameter. Together, the three values describe the fine end, the middle and the coarse end of your material.
D10: The Fine End
D10 is the size below which 10% of your particles fall. If your D10 is 8 microns, then one in ten particles is smaller than that. A very low D10 usually means too many fines, which can lead to dusting, poor flow, clumping or unwanted reactions.
D50: The Median
D50 is the middle point. Half of your particles are smaller, half are larger. It is the number most people quote when they say a powder is “25 microns”, because it gives a quick feel for the typical size. Just remember it cannot tell you how wide the spread is.
D90: The Coarse End
D90 is the size below which 90% of the particles fall, so only 10% are bigger. It is your early warning for oversized particles. A high D90 can mean gritty texture, blocked spray nozzles, rough coatings or uneven dissolution.
Here is a quick example. Say a sample reports D10 = 8 µm, D50 = 25 µm and D90 = 62 µm. That tells you most particles cluster around 25 microns, but there is a noticeable tail of larger particles stretching past 60. If your process needs everything under 50, you have a problem that the median alone would never have shown.
Span: How Wide Is the Spread?
To describe how narrow or broad a distribution is, labs often calculate span:
Span = (D90 − D10) / D50
A low span means the particles are fairly uniform, which usually makes a process easier to control. A high span points to a wide mix of sizes, and that can cause segregation in storage, uneven flow and batch-to-batch variation. Using D10, D50, D90 and span together gives a much clearer picture than any single figure.
How Is Particle Size Measured?
There is no one-size-fits-all method. The right choice depends on your material and the size range you expect.
Laser Diffraction
This is the most widely used method. A laser passes through dispersed particles, and the way the light scatters is converted into a size distribution. It handles a very wide range, from sub-micron to a few millimetres, gives fast and repeatable results, and works on both dry powders and liquid dispersions.
Dynamic Light Scattering
DLS tracks the random movement of tiny particles in a liquid. It is a good fit for nanoparticles, colloids and emulsions in the nanometre range.
Sieve Analysis
The old reliable. Material is shaken through a stack of screens with decreasing mesh sizes. It is simple and economical, and still common for coarse powders and granules in mining, construction and agriculture.
Microscopy and Image Analysis
When shape matters as much as size, microscopy lets you see the particles directly. It is also handy for double-checking results from another technique.
Common Mistakes That Skew Your Results
A good instrument cannot fix a badly prepared sample. These are the problems we see most often:
- Unrepresentative sampling. A spoonful from the top of a drum does not represent the whole batch.
- Poor dispersion. Clumps get measured as single large particles, which inflates D90.
- Over-aggressive dispersion. Too much energy can break the actual particles and make the sample look finer than it is.
- Wrong optical settings. In laser diffraction, an incorrect refractive index can shift the whole distribution.
- No repeat runs. One measurement is a guess. Three consistent ones are a result.
This is why method development matters. An experienced analyst will tune the dispersant, concentration and settings to suit your specific material.
Choosing a Particle Size Analysis Lab in India
If you do not have the instruments or time in-house, working with an external lab makes sense. When you compare options for a particle size analysis lab in India, ask a few simple questions. Does the lab offer more than one technique, so the method fits your sample rather than the other way round? Are the analysts experienced enough to develop and validate methods? Will the report show D10, D50, D90, span and the full distribution curve, along with the method details? And can they turn samples around quickly while keeping your formulation details confidential?
Where Particle Size Analysis Services Make a Difference
Most companies reach for particle size analysis services in a few familiar situations: checking incoming raw materials, keeping batches consistent, troubleshooting flow or dissolution problems, developing a new product, or comparing against a competitor’s material. In each case, knowing how to read D10, D50 and D90 lets your team adjust milling, blending or formulation with confidence instead of trial and error.
Final Thoughts
Good particle size distribution analysis gives you control over how your material behaves, in processing and in the finished product. D10 shows the fines, D50 shows the typical size and D90 shows the coarse tail. Add span to the mix and you have a far better description of your powder than any single average can offer.
If you are unsure how to read your results, or you need reliable testing for your own samples, get in touch with the team at SGM National Lab. We are happy to look at your material and suggest the right method.
FAQS
It measures how much of a powder or suspension falls into each size range, giving a distribution instead of a single average number
D50 is the median size, so half the particles are smaller. D10 and D90 mark the sizes below which 10% and 90% of particles fall, describing the fine and coarse ends.
Size affects flow, dissolution, reactivity, packing, colour and strength, so it can change product quality in minerals, fertilizers, paints and ceramics.
Common methods are sieve analysis, laser diffraction, sedimentation and microscopy. The right one depends on the size range and the material.
Span = (D90 - D10) / D50 and shows how wide the distribution is. A lower span means a narrower, more uniform powder. The ideal value depends on your application.
Yes. Dispersion in liquid can break up agglomerates that stay clumped in dry mode, so choose the method that matches how the material is used.
Mention the material type, expected size range, whether it dissolves in water and the report format you need, such as D10/D50/D90 or a full curve.